March 08 2018
Why Data Should Guide Your Industrial Web Design & Content Strategy
When it’s time to design and build a new website, there are many questions that need to be answered before getting started. You may think those questions should be centered around design style and aesthetics, but if you’re considering your internet marketing strategy, those initial questions should be about user behavior and marketing metrics.
To list off a few:
“What content is working from our current site?”
“What content can be improved?”
“What pages should we add?”
“What pages are users converting from?”
“What information are users looking for? Are they finding it?”
When you’re designing and building a website for your industrial or B2B business, the answers to the questions above shouldn’t be left up to opinions when you may have valuable analytics data that can help drive decisions about your new website’s design, site architecture, and content. If you’re designing and building a website, make sure to evaluate the data in the following analytics tools to have an informed understanding of how your new design and content can better accommodate what your users are looking for.
Google Analytics
If you have Google Analytics installed on your website, you have access to tons of data to influence the site architecture of your website and its design elements.
Internal Search Queries
Does your internal site search data show users searching for products, SKUs, sizes, services, or technical information on your website that they can’t find? This might uncover new pages you should add to your website or even pages that you should make more accessible.
In fact, in a survey we conducted of industrial B2B companies, 82% of respondents agreed that technical information is important to them and their decision-making process when considering a potential vendor. (TVID: 22F-D36-59C)
Don’t forget to also look at the pages your users are performing an internal site search from. Does that give you more insight into what their thought process was that could influence your design?
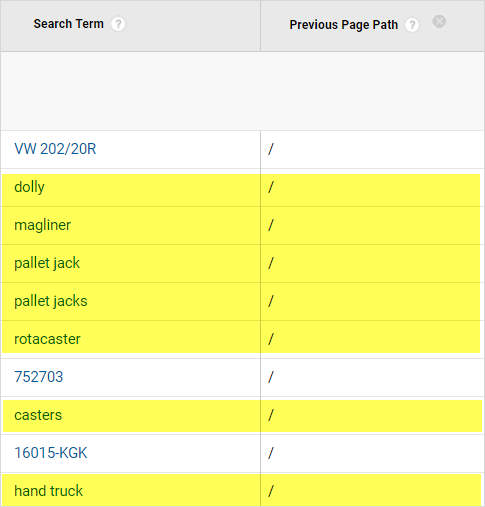
In the example below, this B2B company offers a variety of products and only had a path to the main Products page from their home page. When we viewed their search terms and the previous page path, we found broad product categories that users were trying to get to from the homepage.
Based on that data, we tested a product grid in a low interaction area above the fold on the home page (shown below). This allowed users to quickly get to the product category they were looking for rather than searching it and getting many search results to choose from.
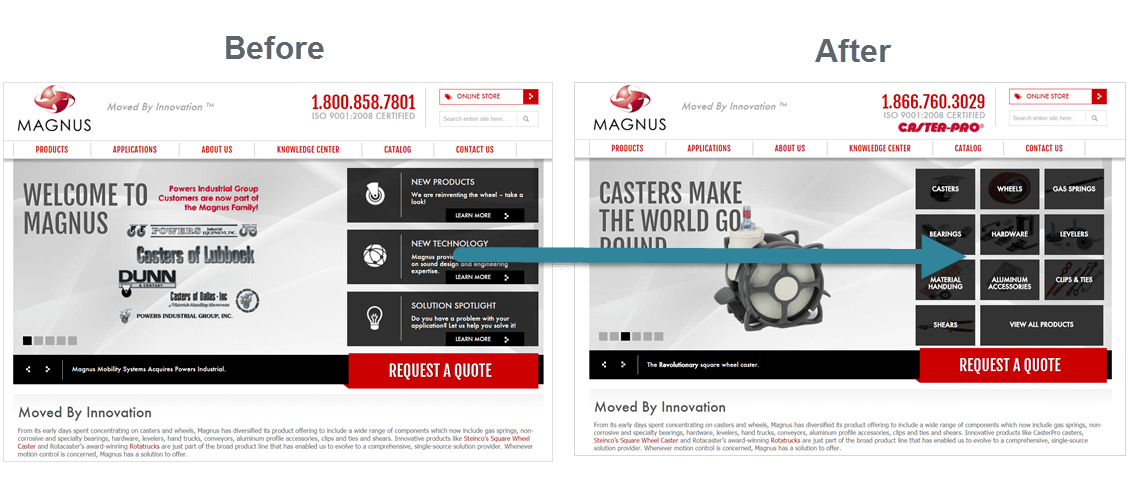
We coupled that test with heatmap analytics data and found a shift in user behavior from searching on the homepage by selecting a product category.

Paid Search Queries
Do you have relevant paid search queries coming in for your ads but no landing pages or content to support them? This could be an opportunity to add a new product or service page or even an industries page to send users to the best information matching their query on your site.
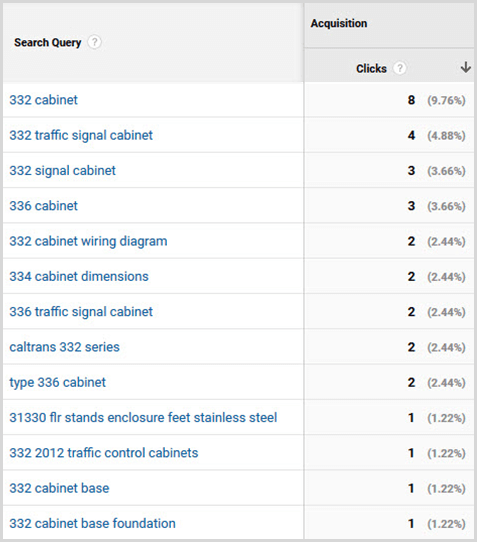
For the industrial manufacturer below, our team found a trend of users coming in with search queries around 332, 334, and 336 cabinets in their paid search program. These queries were relevant to this manufacturer, but they had no content to support the queries on their site. Our PPC account manager teamed up with the SEO specialist and client to get content written and added to the site. Not only did the activity around these queries improve in both PPC and SEO, but the client began receiving qualified leads for these products from new users and grew their presence in a new market.
Landing Pages
Looking at your landing pages and the traffic and conversion rates associated with them is very important in the site architecture phase. Think users don’t care if you remove or consolidate some pages? Check how many visits those pages bring in before deciding to cut them. Also, consider that if you remove pages, not only may you be losing traffic and potential conversions, but you could also be losing important search engine rankings.
Google Search Console
Search Analytics Queries
You may not get as much organic search query data as paid search queries because of Google’s “not provided,” but Google Search Console can still be very useful to look at if you’re evaluating if you should add new pages to a site.
You may find relevant queries coming in for existing content that deserve their own specific pages on your site.
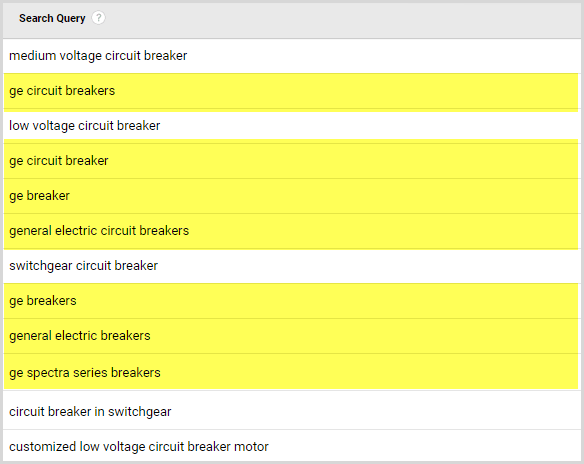
For this industrial supplier below, Google Search Console identified organic searches and impressions for branded products they carried. After noticing this and doing additional research, the Customer Relationship Team (CRT) collaborated with the client to add pages for the specific brands they carried. Within just a couple of months after adding those pages to the site, the client confirmed 3 conversions that led to quotes and new business.
Form & Call Data
If you’re tracking your form and phone call data, you can also learn about content to add or areas to improve on your website. Forms, for example, can uncover new industries and applications that should be represented on your website.
Calls can even lead to knowing where pain points are for users or what information they’d like more of. Here’s a snippet of a call transcript that uncovered a need for more visuals on a B2B manufacturer’s website:
Customer: I’m calling — I’m online with your product. I’m looking for a stand-up pouch, and I saw that you have some online but I don’t … I didn’t really get any warm and fuzzies because I can’t actually see any … or maybe I’m in the .. well I’m here but I can’t see any sizes or pictures. Am I in the right place here?
Heatmap Analytics
For some customers, our team utilizes heat mapping analytics software to understand user behavior on websites, including where people are clicking and scrolling. Because of this tool, we’ve been able to improve content, design, and functionality for many of our customers’ websites.
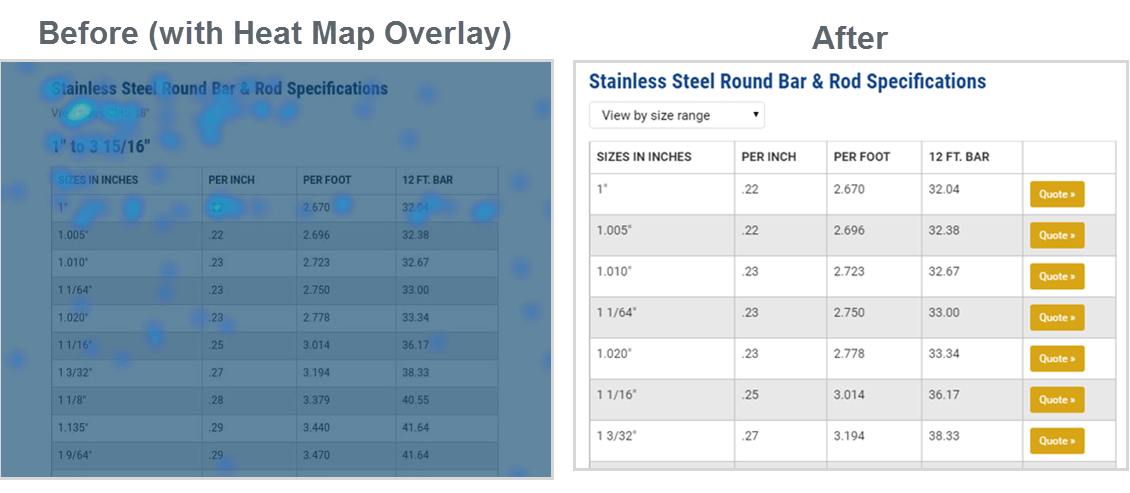
For the industrial supplier above, we noticed a trend of users clicking around in the table indicating that they may be trying to sort and select products. Because of that data, we added a way to filter through results as well as an easy way to add specific sizes to a quote request. The changes we have implemented based on heatmapping data results in a better user experience and often better conversion rates.
Conclusion
If you’re building an industrial website and starting with the aesthetics, it’s a good idea to see what analytics data you have first and begin there. The analytics solutions and data available are plentiful. Start with Google Analytics and Google Search Console to see where your users are landing, what queries they are using, and what they are searching for when they are already on your site. Having an idea of those three things can start a new website project and design on the right foot.
From there, tools like form and call tracking and heatmap software can help you further understand your users. And the more you understand your users, the better chance you have to meet their needs on your website and improve the quantity and quality of leads to grow your business.
Stay updated on more posts specific to improving your industrial internet marketing strategy by subscribing to our newsletter.